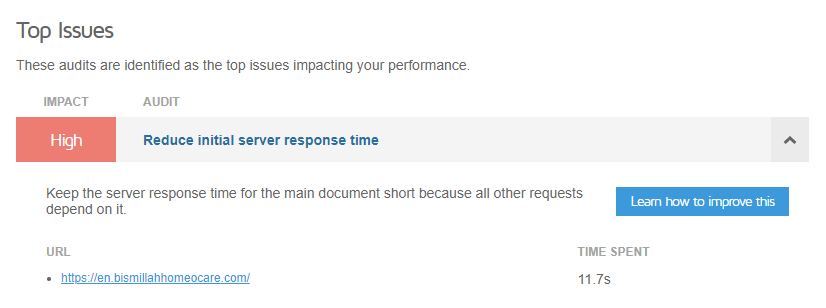
Some time after12.00 Am ( GMT +6.00) gtmetrix shows an error because it took too much time to respond.
According to gtmetrix Prev response time was 700-900 ms. Now it more than 10s.
You can see the result. From my side it takes 22sec, sometimes it takes more time to respond. (Not full load, just response) But according to the previous history, it took 4/5 to load full website.
Now you can say that my site my site getting more traffic time than previous time.
No, I think all traffic flow is normal. Here is last month traffic data from Cloudflare
Is the web server slow? Perhaps. But there are many, many reasons why a website could be slow. It could be a website server issue, it could be the database server being slow, or it could be something specific to your website.
It’s generally hard to prove anything specific is the culprit, unless you have advanced debugging tools which are both hard to use and not available on our hosting.
And even if the server would be slower than before, that doesn’t mean we’ll be able to do something about that.
Now I think it’s database/database server issue, not files server. Because I have noticed so many time that my website was unable to connect database. It resolved automaitaclly after refreshing 1,2 or 3rd time.
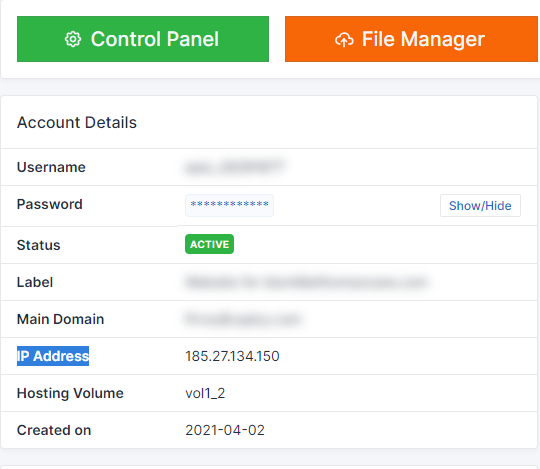
Note: now my custom root domain hosted in another hosting and tt’s sub domain is in infinityfree (subdomain that is hosted in infinityfree en.MYCUSTOMEDOMAIN.com)
Not all time Sometimes it shows Database connection error. Today I have faced that problem (database connection failed), then I was remembered that you told one of reason could be
That’s why I shared the experience. It happened approx. 7-10 times in 4 months. Maybe what I am thinking is wrong.
I wrote this reply after faceing “Database connection error” problem
One more info that I need to add.
Now 10:12 PM (GMT +6) my subdomain that is hosted in infinityfree is working as before (without slowing), I hope it will be slow again today (another time of day or night)